- Accepting your opinion isn’t your biggest asset
- Understanding the importance of relative measurement
- Data and bankroll management
Learning about how betting works
The first step to becoming a serious bettor is to have a complete understanding of how betting works, and the gravity of the task at hand when trying to make money from betting. That is to say that before you can figure out how to beat the market, you need to know how it works.
Betting is often seen as a contest between the bettor and the bookmaker. You use whatever is at your disposal to try and predict what might happen for any given event. You then place your money (a bet) on what the bookmaker offers you for your prediction to be right (the odds). If you’re right, the bookmaker pays out. If you’re wrong, they get to keep your money. However, there is a lot more to it than just that.
Betting is more bettor vs. bettor, with the bookmaker acting as a facilitator that takes a cut for their part in the process – this “cut” is their margin. The margin is a discrepancy (in the bookmaker’s’ favour) between the probability offered by the odds and the actual statistical probability of the outcome of an event.
The potential outcomes for any event can only ever add up to 100% in terms of probability. However, when you convert a bookmaker’s odds into a percentage, the total will exceed 100% (the excess amount tells you what the bookmaker’s margin is). The bigger the margin on the odds, the more difficult it is to find a “value” bet and make consistent profit.
Another misconception in terms of how betting works is that the bookmaker determines the odds they offer. A bookmaker will post odds initially, but from that point on the odds are controlled by money and opinions in the betting market. The bookmaker will usually move odds to try and secure a profit regardless of the outcome, or take a position to maximise their potential profit.
- Read: Reverse line movement
Anyone who is serious about betting will know that their task is to be consistently more accurate in their predictions for event outcomes than the betting market. Making these predictions isn’t easy, but it’s also important to know when there is value in betting on these predictions (just because your prediction is more likely to be right than wrong doesn’t mean you should bet on it.
Analysing the odds, comparing margins, and shopping around to make sure you get the best possible value before you place a bet should be part of every serious bettor’s process.
Accepting your opinion isn’t your biggest asset
In addition to not putting in the time to understand how the betting market works, one of the biggest failures bettors can make is overestimating the power of their opinion (even when it is based on sound knowledge or research).
The more involved you get in betting, the more you need to accept that your predictions will be wrong
If you want to take betting seriously, you need to be able to detach yourself from both your bets, and your results. Given the resources a bookmaker has at their disposal to help them post the initial odds, as well as the money and information from other bettors, it is unrealistic to think that your knowledge alone is enough to beat the market.
This is not to say that anyone who wants to make money from betting has to build a complex predictive model, it just means that relying on your own insight and intuition is very unlikely to help you succeed.
In order to consistently make a profit from betting you need to hold an advantage over the rest of the market (known as an edge). You also need to know how this edge is produced and precisely when it should be used.
Additionally, the more involved you get in betting, the more you need to accept that your predictions will be wrong. Serious bettors know how often they need to win to make money and that losses are part of the process. They will not only be able to accept that they were wrong, but also be able to analyse and understand where they went wrong – and how to improve.
Understanding the importance of relative measurement
Using a hypothetical example, suppose Bettor A has an open bet with a stake of €50,000 and Bettor B an open bet with €500 at stake. Who do you think people would say is the serious bettor? While it may well be the former, it could also be the latter. Absolute figures tell us very little in betting, and they certainly tell us a lot less than relative measurement.
Bettor A could be a millionaire who is merely betting for entertainment. Bettor B might have identified an edge, found the bookmaker offering the best odds to maximise that edge and calculated how much to stake based on this edge in relation to their total bankroll.
A serious bettor will likely pay little attention to the absolute number they have bet, won or lost. Instead, they will think about things in percentage terms compared to their overall investment for that week, month, year, decade or entire betting career.
This isn’t to say serious bettors don’t care about money, it’s just that they are removed from it enough that it doesn’t impact the decision-making process when placing a bet, or any reactionary behaviour after winning or losing a bet.
Data will give you the answers you need
One of the biggest questions a serious bettor will have to answer is whether their success or failure was down to luck or skill. If people are betting for fun they might not know this question even needs to be asked, and assume it is always down to their skill, or lack of it.
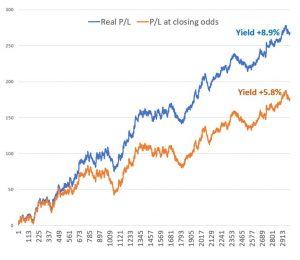
The true test of whether or not you are a skilled bettor is whether the odds you bet are shorter at the closing line
Collecting data on your results is an important part of betting (especially if you’re trying to make a living out of it). This doesn’t just mean bets won and lost, or profit and loss, but ROI (return on investment) over a given period.
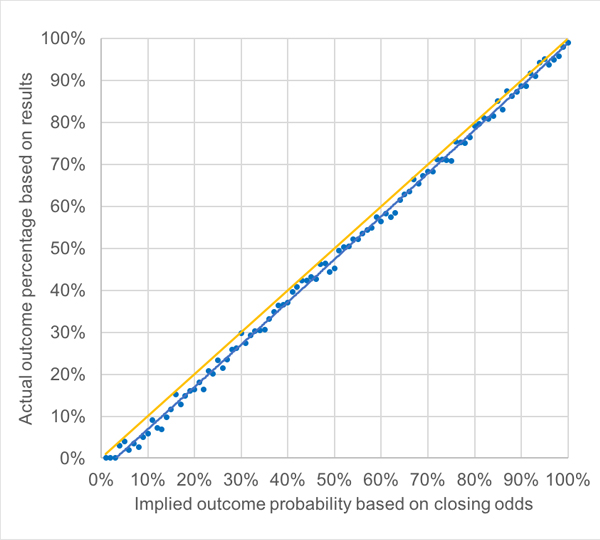
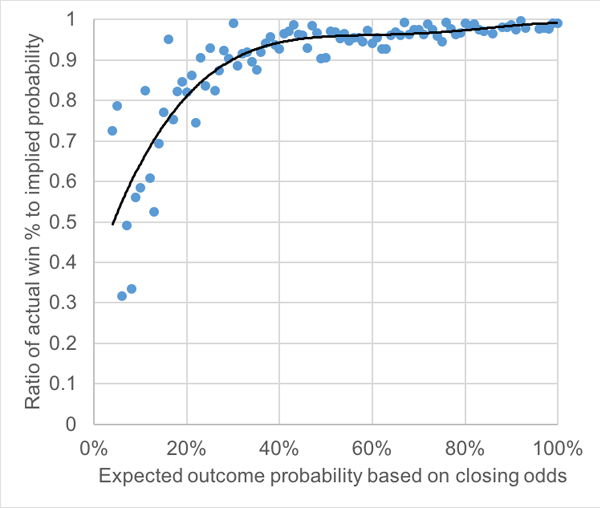
As you get more serious about betting this will likely develop into tracking the odds you bet with against the market closing odds. The closing odds (or closing line) are the last available odds before an event starts (before the market closes, hence the name). These are the most efficient odds available and the closest you can get to true probability prior to an event taking place.
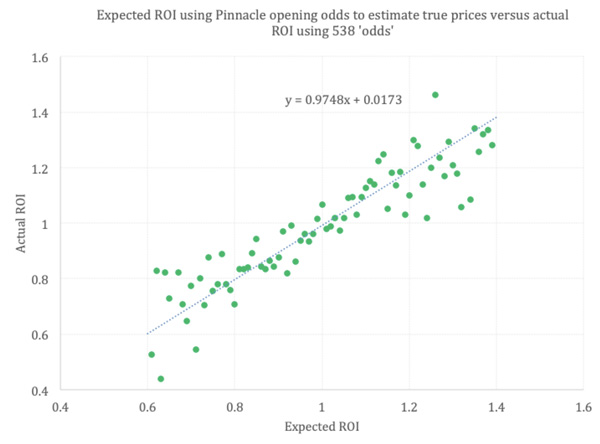
The true test of whether or not you are a skilled bettor is whether the odds you bet are shorter at the closing line (with Pinnacle’s odds widely regarded as the most efficient in the market). This is because the market ultimately adjusts to what you deem to be a value bet and shortens accordingly.
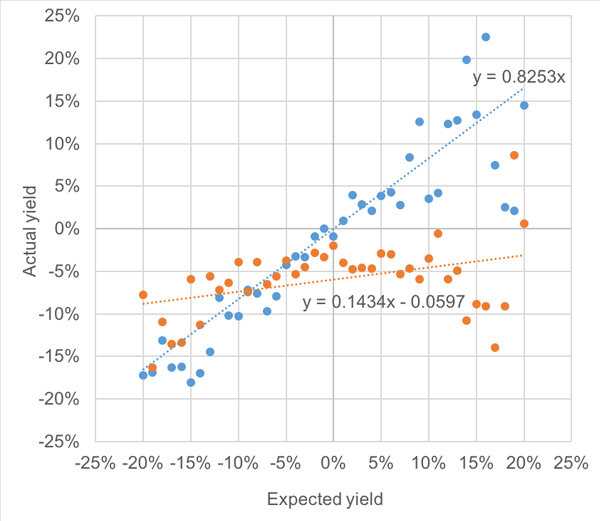
Regardless of whether your bet wins or loses, if the odds you’ve taken shorten before market closure it is a good indication that you have placed a bet that offers positive expected value. If you manage to continuously achieve this then, in theory, you will make a consistent profit from betting.
When you begin to analyse this information it becomes clear that it is very difficult to attribute results solely to luck or skill. If you are serious about betting then you need to accept there will always be an element of randomness to what happens, and a failure to do so means you will be exerting a lot of energy on what will ultimately be a thankless task.
About the author

The post Are you serious about betting? appeared first on Sports Trading Network.